
What Is the Directional Movement Index (DMI)?
The Directional Movement Index (DMI) is a technical indicator developed by J. Welles Wilder to measure the strength and direction of a market trend. It’s composed of three lines:
- +DI (Positive Directional Indicator): Measures upward price movement.
- –DI (Negative Directional Indicator): Measures downward price movement.
- ADX (Average Directional Index): Gauges overall trend strength, regardless of direction.
Together, these components help traders determine whether a currency pair is trending or ranging, and how strong that trend might be.
Key Takeaways
- DMI = +DI, –DI, and ADX.
- ADX above 25 = strong trend confirmation.
- Use DMI with other tools (RSI, moving averages) for better accuracy.
- Avoid low ADX environments to prevent false signals.
How the DMI Works
Wilder’s formula compares highs and lows between periods to determine which side — buyers or sellers — is in control. Here’s a simplified breakdown:
| Component | What It Measures | Interpretation |
| +DI | Strength of upward moves | A rising +DI indicates bullish pressure. |
| –DI | Strength of downward moves | A rising –DI indicates bearish pressure. |
| ADX | Trend strength (0–100 scale) | Above 25 = strong trend; Below 20 = weak trend. |
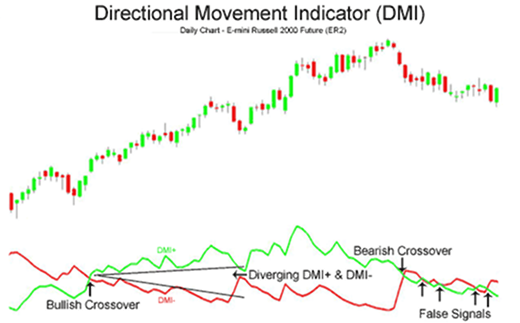
When +DI crosses above –DI, it suggests a potential bullish signal.
When –DI crosses above +DI, it signals a possible bearish move.
Formula Summary
To calculate DMI manually (for those using Excel or backtesting):
- Directional Movement (DM):
- UpMove = Current High – Previous High
- DownMove = Previous Low – Current Low
- +DM = UpMove if greater than DownMove and > 0
- –DM = DownMove if greater than UpMove and > 0
- UpMove = Current High – Previous High
- Smooth using Wilder’s Moving Average
- Compute +DI and –DI:
- +DI = (Smoothed +DM / ATR) × 100
- –DI = (Smoothed –DM / ATR) × 100
- +DI = (Smoothed +DM / ATR) × 100
- Compute ADX:
- ADX = 100 × (Smoothed |(+DI – –DI) / (+DI + –DI)|)
- ADX = 100 × (Smoothed |(+DI – –DI) / (+DI + –DI)|)
How to Interpret DMI Signals
✅ 1. Identifying Trend Direction
- When +DI > –DI, the trend is bullish.
- When –DI > +DI, the trend is bearish.
✅ 2. Measuring Trend Strength
- ADX above 25 confirms a strong trend.
- ADX below 20 suggests sideways or weak momentum.
Pro Tip: A rising ADX line confirms a strengthening trend — even if price retraces temporarily.
Practical Example from Real Trading
In my EUR/USD swing trades during the 2023 Fed rate hike cycle, I noticed:
- When +DI crossed above –DI and ADX climbed from 18 to 30, the pair broke above resistance at 1.0800 and rallied over 150 pips in two days.
- Conversely, when ADX dipped below 20, price action became choppy — signaling it was time to step aside and wait for a stronger move.
Such experiences reinforce how DMI helps traders avoid false breakouts and trade only during high-probability trends.
How to Use DMI in Your Trading Strategy
| Strategy | Signal | Confirmation | Action |
| Trend Following | +DI crosses above –DI | ADX > 25 | Enter long |
| Trend Reversal | –DI crosses above +DI | ADX > 25 | Enter short |
| Trend Filter | ADX < 20 | N/A | Stay out or range-trade |
Combine DMI with:
- Moving Averages: For trend confirmation.
- RSI: To identify overbought/oversold conditions.
- Support/Resistance: To validate breakout entries.
Once you’ve identified a strong trend using DMI, you can apply it in live market conditions through a regulated CFD broker like Fintana — which offers access to Forex, indices, metals, and other assets with competitive spreads and professional trading tools.
Common Mistakes When Using DMI
- ❌ Relying on ADX alone:
ADX shows trend strength, not direction. Always check +DI and –DI. - ❌ Ignoring Market Context:
DMI performs best in trending markets — avoid using it in consolidations without confirmation. - ❌ Late Entries:
Wait for a clear cross between +DI and –DI with ADX confirmation to avoid whipsaws.
Best Practices for Forex Traders
- Adjust the period: The standard 14-period DMI works well, but swing traders may prefer 20–25 for smoother results.
- Backtest thoroughly: Apply DMI to your preferred pairs (e.g., EUR/USD, GBP/JPY) and timeframes.
- Use as part of a system: Combine with price action, moving averages, or Bollinger Bands for added reliability.
Advantages & Limitations
| Pros | Cons |
| Identifies trend strength early | May lag in volatile markets |
| Helps filter out false signals | Less effective in sideways markets |
| Works across all timeframes | Requires experience to interpret properly |
Why the DMI Still Matters in 2025
In the era of algorithmic trading and AI-based analysis, traditional indicators like the DMI remain invaluable. They provide a clear, mathematical view of trend strength, which helps both discretionary and system-based traders filter noise and optimize timing.
As a verified forex analyst, I still rely on the DMI in combination with modern volatility tools to assess momentum sustainability — a skill that separates profitable traders from impulsive ones.